On mobile?
Email yourself the setup link so you can finish when you're at your computer.
✓ Email sent! Check your inbox.
× Failed to send. Please try again.
⏱ Too many attempts. Please wait a few minutes and try again.
Collect application crash reports and production error logs in a single timeline. Inspect stack traces, identify root causes, and see how many users were impacted - without guessing what happened in production.
A crash tells you where your app failed.
Logs tell you what was happening when it did.
A stack trace shows where the code crashed, but not the conditions that led to it. Without logs, debugging turns into guesswork.
Production bugs don’t get fixed faster with more guessing, they get fixed with better context.
AppAmbit collects logs, errors, and crashes into a single system. Every log and crash links directly to its session timeline - and every session timeline links back to the exact logs and crashes that occurred., See real log details
Capture meaningful logs with messages, context, and metadata - not raw console noise.
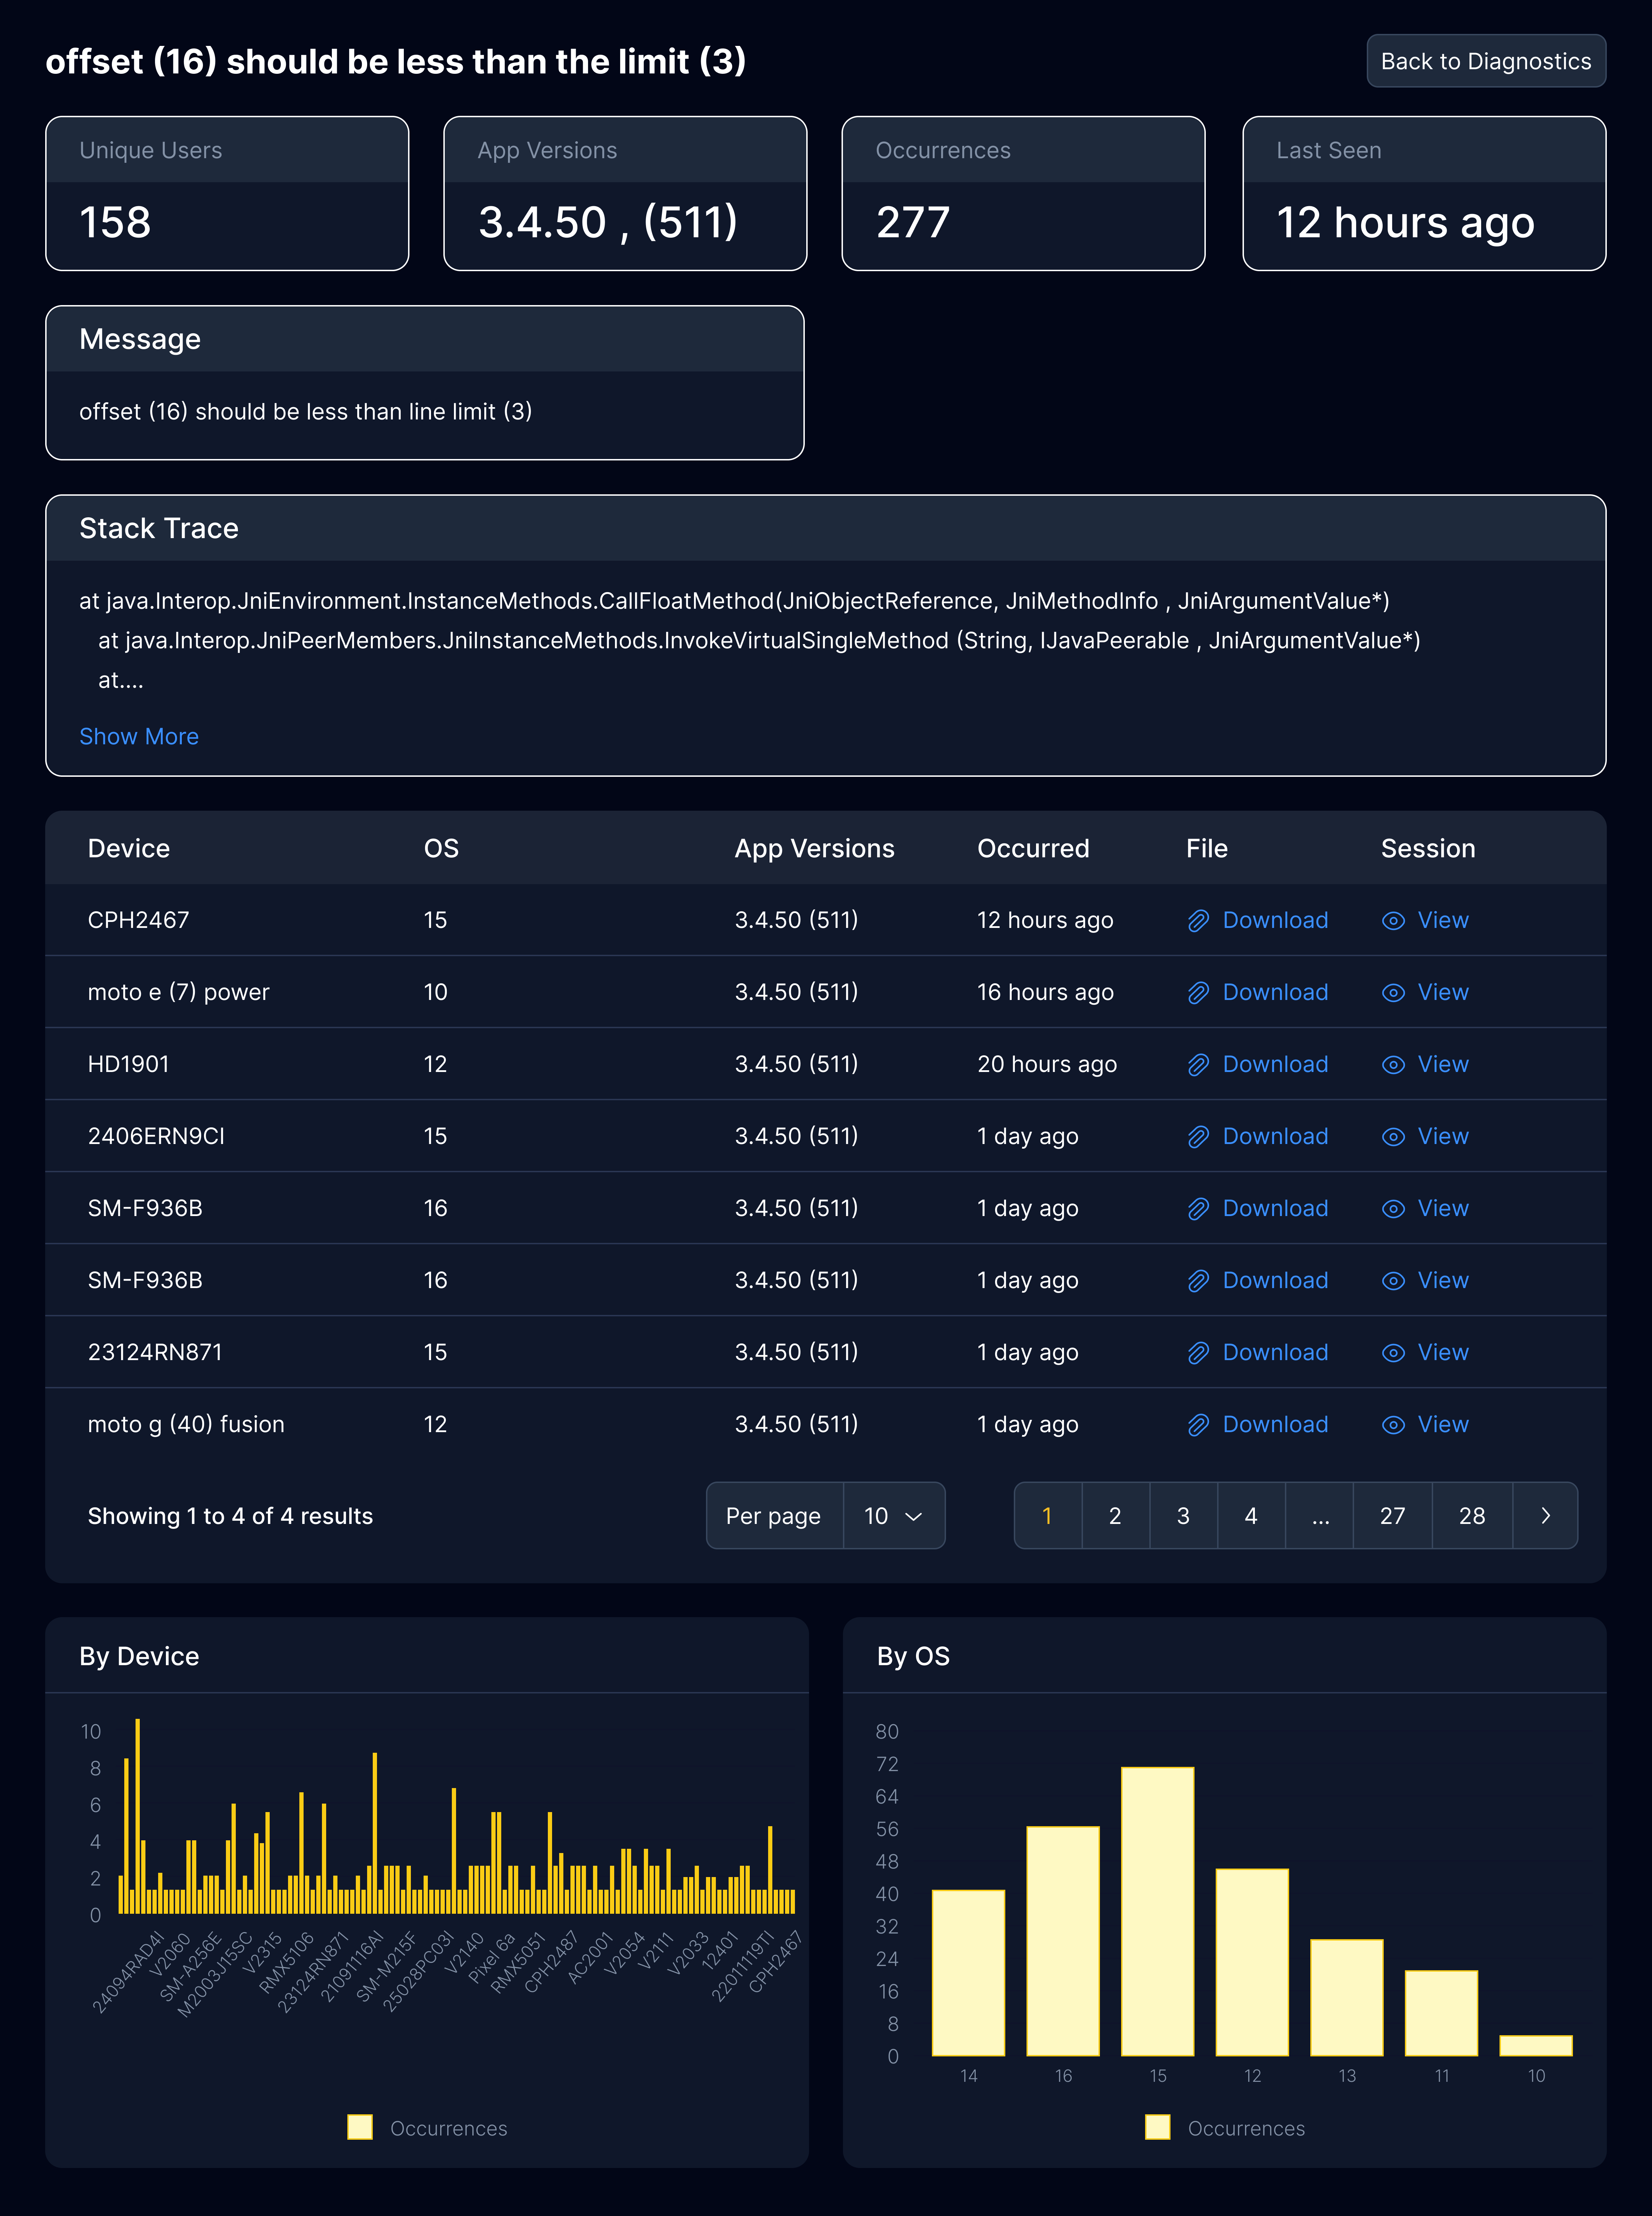
Every crash includes stack traces, occurrence counts, and number of affected users.
See which errors matter most based on frequency and real user impact.
Similar errors are grouped automatically, so you fix root causes, not individual events.
AppAmbit automatically captures application logs, warnings, errors, and crashes as your app runs in production. Everything is timestamped, structured, and tied to the exact user session., See a real timeline
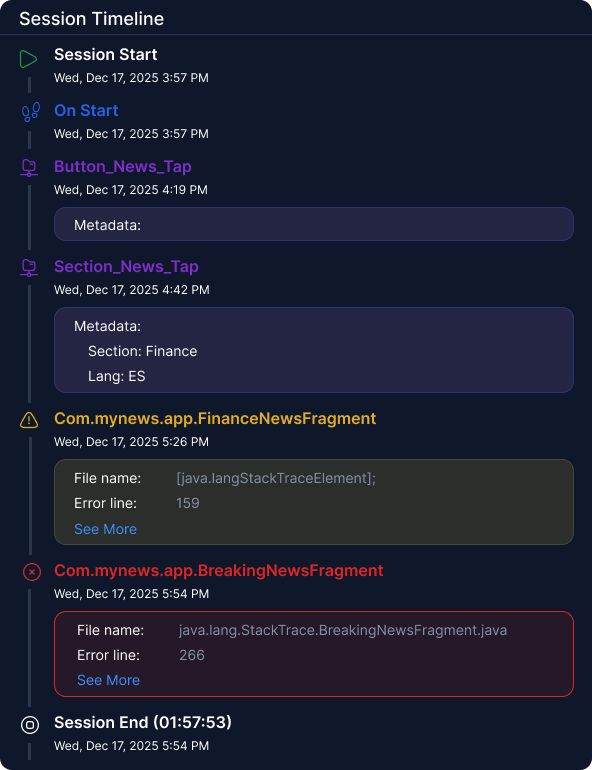
Logs, events, and crashes are all linked to the session timeline, so you can jump from a crash to its logs, from any log or event to the full session timeline, or navigate back and forth for more context.
The crash report shows a timeout error repeated twice. The logs reveal that the retry logic returned a null response, which wasn’t handled before accessing the payload. Root cause identified in seconds.
Fix the null check. Ship a hotfix. No reproduction attempts. No guesswork.
What used to take hours of log-diving, breakpoints, and repeated reproduction attempts now takes minutes. The error, its frequency, and its cause are immediately clear.
| Feature | Traditional Logs | AppAmbit |
|---|---|---|
| Context | Raw log lines | Full session context |
| Crash Correlation | Separate systems | Logs inline with crashes |
| User Impact | Hard to determine | Affected users visible |
| Error Grouping | Manual filtering | Automatic grouping |
| Root Cause Analysis | Guesswork | Clear in minutes |
| Time to Fix | Hours to days | Minutes |
AppAmbit gives you full visibility into what actually happens in production - from structured logs to crashes, all connected inside the same session timeline. No guesswork. No manual correlation.
Instead of jumping between tools, AppAmbit shows you the full story - so you can debug faster and ship with confidence.
See every error, understand its impact, and fix production issues with confidence.