On mobile?
Email yourself the setup link so you can finish when you're at your computer.
✓ Email sent! Check your inbox.
× Failed to send. Please try again.
⏱ Too many attempts. Please wait a few minutes and try again.
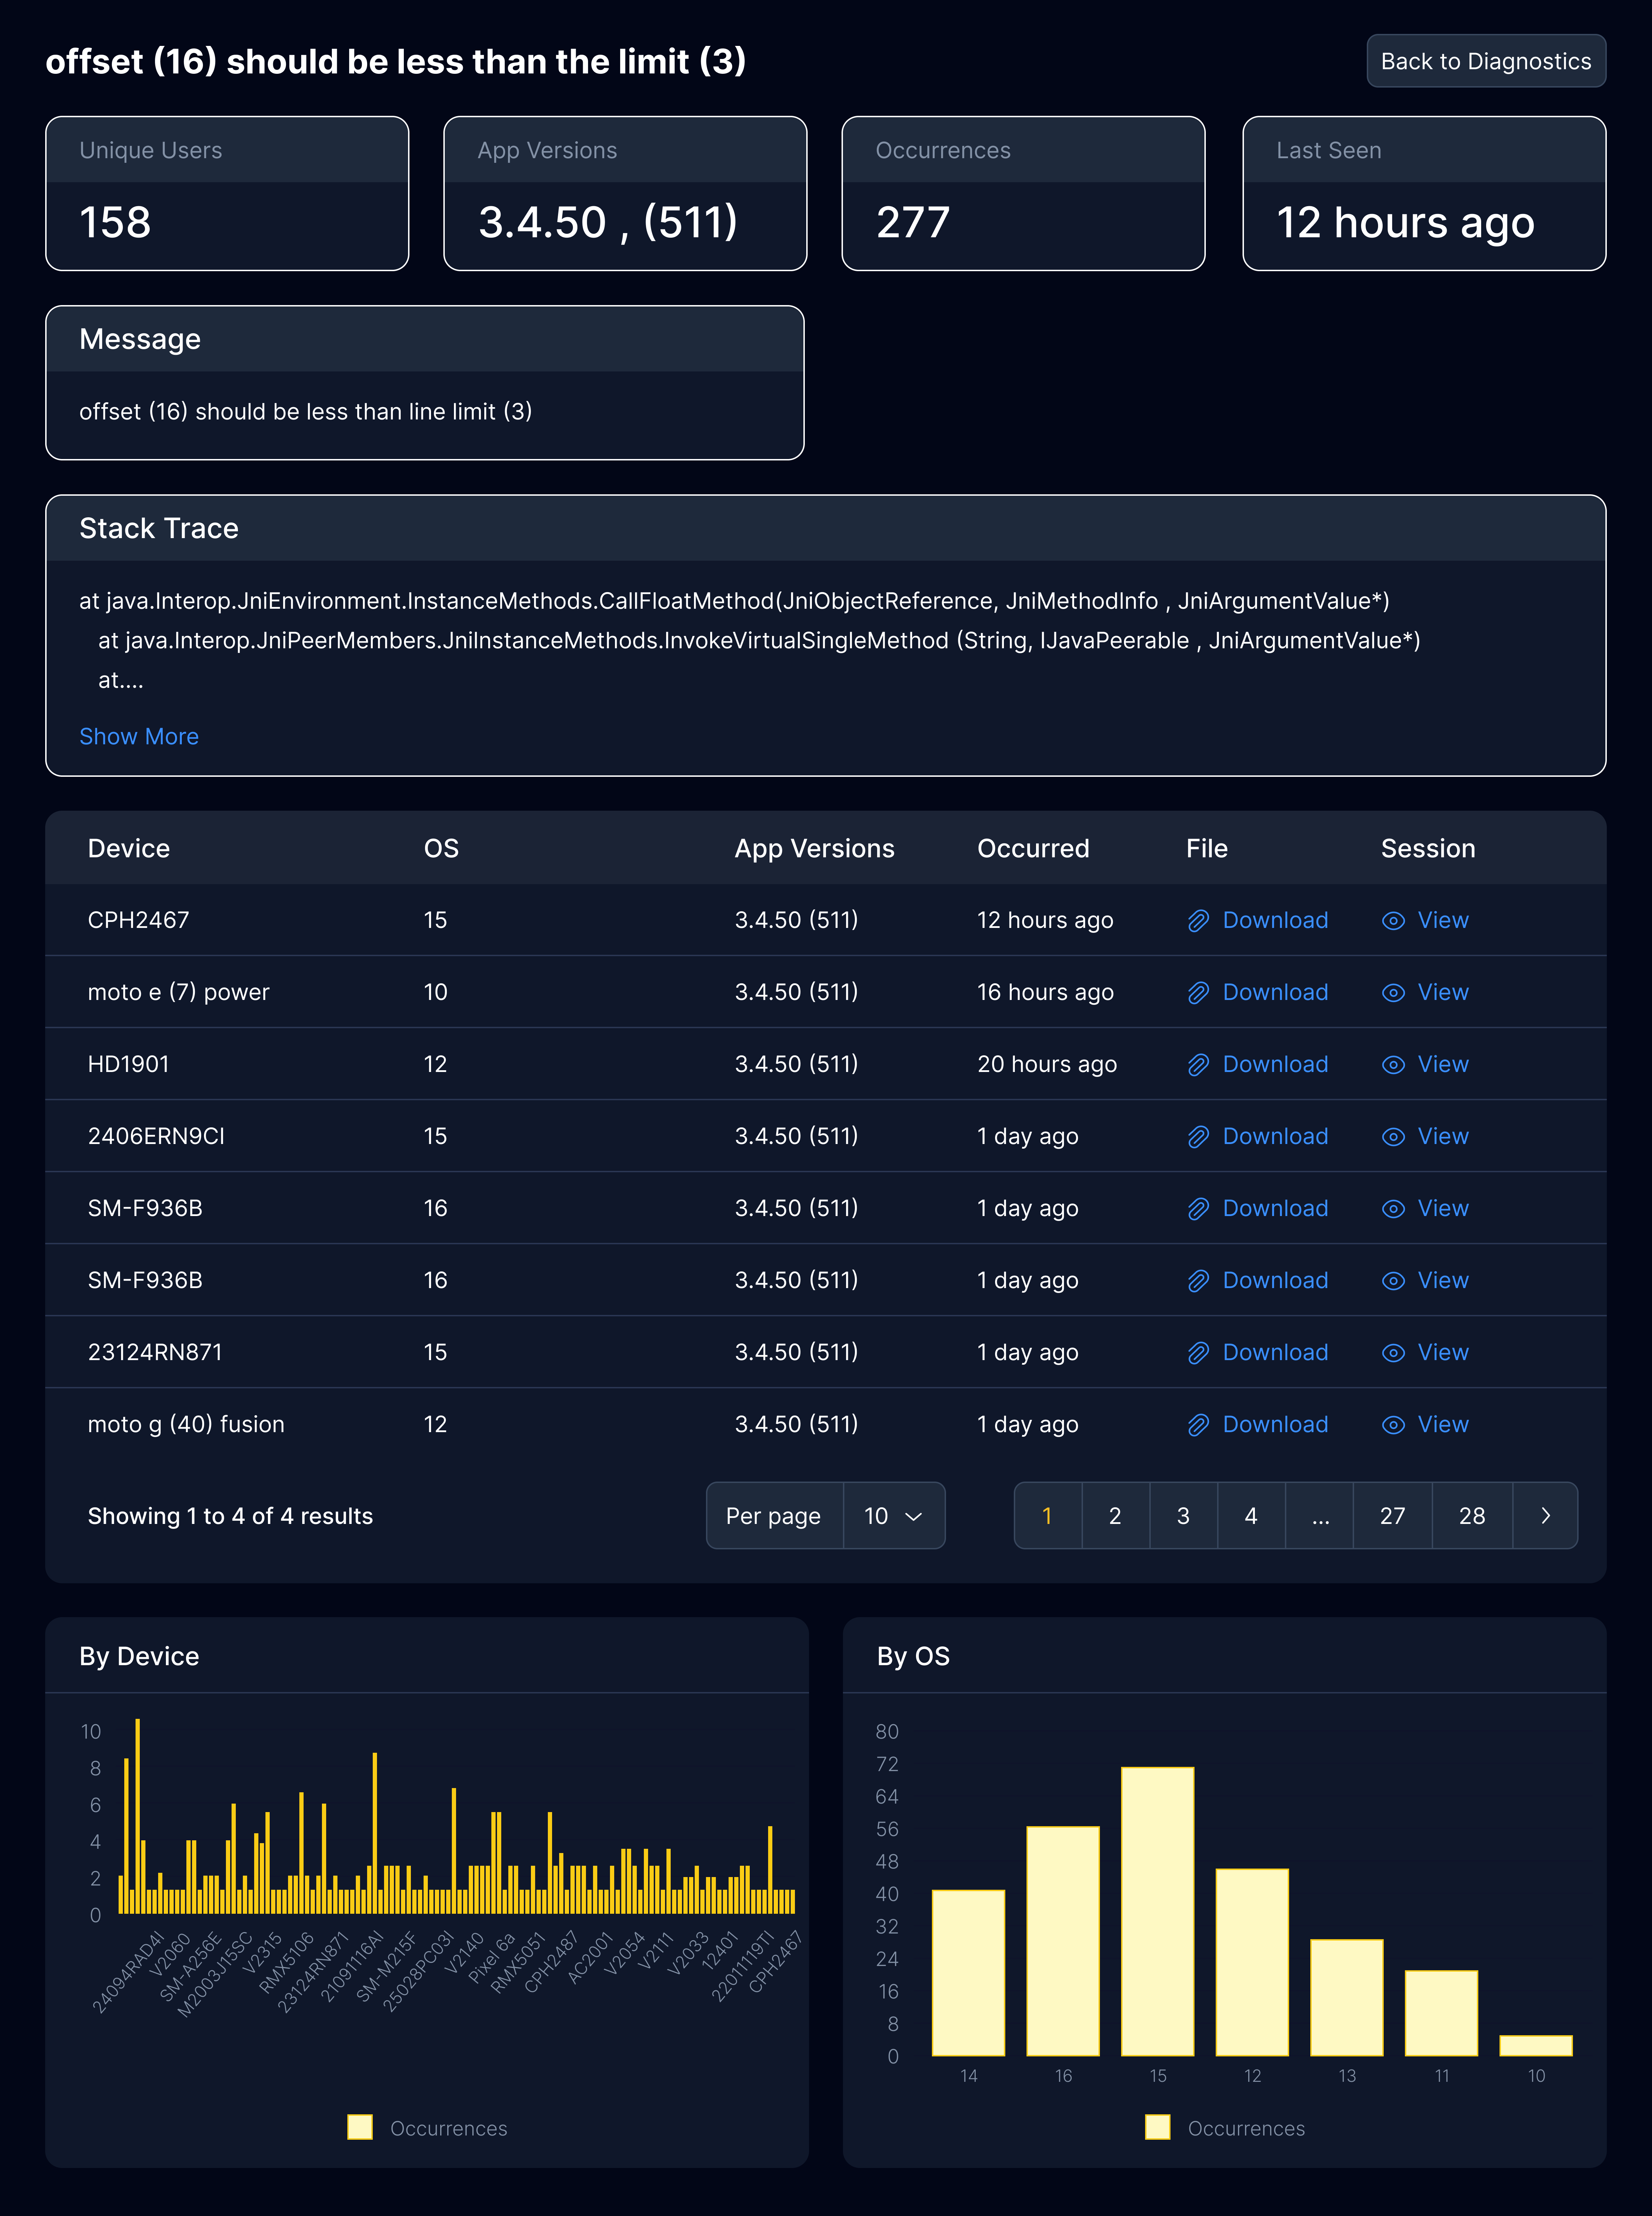
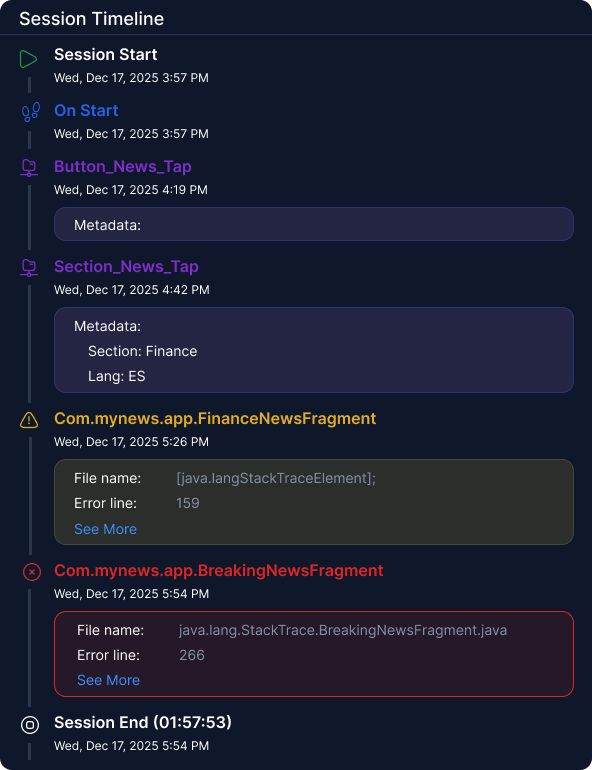
Every crash comes with the whole session behind it: lifecycle, screens, taps, events, logs and network calls, in the order they happened. Read it top to bottom and the cause is right there, no reproduction needed. See it in your dashboard, or ask your AI Agent to read it over MCP.
Built from your breadcrumbs, next to your crash reports. Works on iOS and Android.
The whole session, in order, straight to the crash.
You get a crash at 2am: a null reference on line 247. It tells you where the app died, but not how the user got there. Logs live in one tool, events in another, and the real journey is stuck in a ticket titled "app crashed pls fix." So you burn hours trying to reproduce it.
Every one of these is a question a bare stack trace cannot answer:
The session timeline answers all four before you finish reading it.
Read the timeline yourself in your AppAmbit dashboard, or point your AI Agent at it over MCP. It walks the same record and answers in plain language, with the steps that led to the crash.
Found the cause? Flip a flag from the same dashboard with remote config.
you › Why did the Save screen crash on iOS v2.4.1?
→ appambit.sessions.query(crash: "NullReference", version: "2.4.1")
Root cause: two timeouts, null response reached the view model unhandled.
Your breadcrumbs are the automatic markers. The session timeline is where they line up next to your events, logs, network calls and the crash itself, in one chronological record.
App start, resume, pause and background, captured automatically.
Every screen and page view, in the order the user opened them.
Taps, form submits and the navigation they set off.
Your tracked events and the automatic breadcrumb markers, inline.
Breadcrumbs →Requests, timeouts and failures, with the timing around them.
The app crashes after a tap on "Save." You do not reproduce anything. You read the record: the user opened Profile Edit, tapped Save, the POST timed out twice, the retry got a null response, and the next line is the crash. The cause is in the steps.
No repro. No steps pulled from a support ticket. The story is already recorded.
Hours to minutes
Reproduction and log-diving collapse into one read.
Fix, not guess
You patch the real cause, so it does not come back.
The old way
Traditional crash reportsThe AppAmbit way
Session timelineYou ship weekly, sometimes daily. Flags flip, pipelines run on their own. When debugging is the slow part, everything backs up behind it. Reading a session instead of reproducing one keeps you moving.
Find and fix a crash in minutes, then get the patch out before users churn.
See exactly what broke and fix it surgically, instead of rolling back a whole release.
When any crash is one session read away from a fix, you ship without holding your breath.
Start the SDK once and lifecycle, screens and sessions are recorded for you. Add your own events and breadcrumbs to make the record richer. Every crash arrives already linked to the session behind it.
Every crash opens with its own session already attached. No searching, no correlation by hand.
Crash monitoring →Lifecycle, screens, actions, events, logs and network all fall into a single ordered record.
Version, build number, OS and device ride along, so you know exactly what you are debugging.
Audience →The timeline is there even for builds you did not distribute through AppAmbit.
Start free and we spin up a demo app with live session timelines to explore. See the product first, connect your real app when you are ready. No credit card required.
Debug crashes from the whole session.